
FROM SIMPLE MICROCONTROLLERS TO COMPLEX MULTICORE SOCS
RISC-V cores can be found in increasingly more chips, either as the main CPU(s) or as a companion core together with other CPU architectures. This article explains RISC-V debugging and shows, that even multicore debugging with RISC-V cores is not rocket science and that there are efficient methods to master even complex chips with complex software configurations.
From Frank Riemenschneider, Senior Marketing Engineer, Lauterbach GmbH
RISC-V is an open standard instruction set archi- tecture (ISA) based on established reduced instruction set computer (RISC) principles. Unlike most other ISA designs, RISC-V is provided under royalty-free open-source licenses.
As a RISC architecture, the RISC-V ISA is a load- store architecture. Its floating-point instructions use IEEE 754 floating-point. Notable features of the RISC-V ISA include instruction bit field locations chosen to simplify the use of multiplexers in a CPU and a fixed location for the sign bit of immediate values to speed up sign extension.
The base instruction set has a fixed length of 32-bit naturally aligned instructions, and the ISA supports variable length extensions where each instruction can be any number of 16-bit parcels in length. The instruction set specification defines 32-bit and 64-bit address space variants. The specification even includes a description of a 128-bit flat address space variant, as an extrapolation of 32- and 64-bit variants.
The RISC-V Foundation was formed in 2015 to own, maintain, and publish intellectual property related to RISC-V’s definition. The founding members of RISC-V were: Andes, Antmicro, Bluespec, CEVA, Codasip, Cortus, Esperanto, Espressif, ETH Zurich, Google, IBM, ICT, IIT Madras, Lattice, lowRISC, Microchip, MIT (Csail), Qualcomm, Rambus, Rumble, SiFive, Syntacore, and Technolution.
In the meantime, other major semiconductor sup- pliers have implemented RISC-V-based CPUs or accelerators in their chips, including NXP and Renesas, which introduced the industry’s first general-purpose 32-bit RISC-V MCU series with an internally developed CPU core in early 2024.
Also in early 2024 a new company Quintauris was founded as a single source to enable compatible RISC-V-based products, provide reference archi- tectures, and help establish solutions to be widely used across various industries. Shareholders are leading industry players Bosch, Infineon, Nordic Semiconductor, NXP and Qualcomm [1].
Each chip and core supplier is free to decide which functions its RISC-V core(s) support and how they are integrated into the overall system. While the complexity of SoCs grows with the number of cores and the number of different core architectures, the challenges for embedded developers grow expo- nentially with operating systems, hypervisors, and other software running across multiple cores and/ or architectures.
Debugging RISC-V Cores
RISC-V’s open-source nature and diverse eco- system pose unique challenges in debugging applications. In order to avoid a proliferation of proprietary debug interfaces, a working group within the RISC-V Foundation has defined a debug standard. Lauterbach, the global market leader for debug and trace tools, has been a strategic member of the RISC-V Foundation from the very beginning and has made a significant contribution to the debug standard within this working group.
The RISC-V Debug Specification outlines standar- dized interfaces for debugging, including but not limited to, external debug support (EDS) and ad- vanced features for run-control debugging. Familia- rity with this specification is essential, as it guides the use of hardware breakpoints, watchpoints, and control over the CPU’s execution flow, offering a structured approach to hardware debugging.
The latest ratified release of the official RISC-V de- bug specification has the version number v0.13 [2]. The document outlines a standard architecture for external debug support on RISC-V platforms. This specification allows a variety of implementations and tradeoffs, which are ideally suited to the wide range of RISC-V implementations. At the same time, the specification defines common interfaces to allow debugging tools and components to target a variety of platforms based on the RISC-V ISA.
Figure 1 shows the main components of external debug support. Blocks shown in dotted lines are optional. The user interacts with the debug host, which is running a debugger like TRACE32® PowerView from Lauterbach. The debugger communicates with a debug translator to commu- nicate with debug transport hardware. The debug transport hardware connects the debug host to the Platform’s Debug Transport Module (DTM). The DTM provides access to one or more Debug Modu- les (DMs) using the Debug Module Interface (DMI).
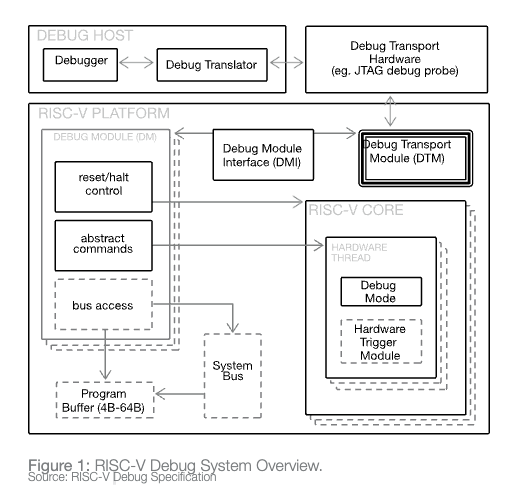
Each hart (Hardware Thread [3]) in the platform is controlled by exactly one DM. Harts may be hetero- geneous. There is no further limit on the hart-DM mapping, but usually all harts in a single core are controlled by the same DM. In most platforms there will only be one DM that controls all the harts in the platform. DMs provide run control of their harts in the platform. Abstract commands provide access to Ge- neral Purpose Registers (GPRs). Additional registers are accessible through additional abstract commands or by writing programs to the optional Program Buffer.
The Program Buffer allows the debugger to execute arbitrary instructions on a hart. This mechanism can also be used to access memory. An optional system bus access block allows memory accesses without using a RISC-V hart to perform the access. Each RISC-V hart may implement a Trigger Module. When trigger conditions are met, harts will halt and inform the debug module that they have halted.
The RISC-V ISA consists of several optional pieces, referred to as the ISA extensions, which impact the naming convention of the final device. These extensions can be combined. Examples for standard RISC-V ISA extensions: “I” (integer), “M” (multiplication), “F” (floating-point) and “C” (com- pressed). It is also possible to add one’s own custom (non-standard) RISC-V ISA extensions. The Lauterbach TRACE32® RISC-V disassembler can support such custom ISA extensions in two ways: They can be integrated into the TRACE32® Power- View software directly, or via an APU API, which allows developers to create their own custom disassembler plugin [4].
Furthermore, with Lauterbach’s TRACE32® tools, developers can now debug and control RISC-V cores in almost any combination with other CPU architectures via a single debug interface. Many SoCs implement different kinds of cores; in addition to RISC-V one often finds Arm® CPUs or other proprietary cores, e.g. DSPs such as ARC® or Xtensa®. No matter what kind of multicore system is used, TRACE32® supports them all. TRACE32® supports full on-chip breakpoint capabilities, run-time memory access, flash programming, and benchmark counters. Everything is scriptable, which enables developers to automate tests very easily. Developers can use any debug interface protocol such as classic JTAG, compact JTAG (2-wire), Arm CoreSight SoC-400/600 (SWD, APB, JTAG-AP, CTI) and Tessent debug interfaces (JTAG/USB communicator, JPAM, cross-triggering).
Another advantage of Lauterbach’s TRACE32® is OS-aware debugging which provides key insights into applications and the operating systems they are running on, regardless of whether its a rich operating system like Linux, a real-time operating system (RTOS) such as Zephyr OS or FreeRTOS or a mixture of all types [5]. TRACE32® OS-aware debugging can query and display all OS objects such as threads, message queues, and more. With this, engineers can better understand how these are behaving and utilizing chip resources.
Tracing RISC-V Cores
In complex systems understanding program behavior is not easy. Unsurprisingly in such systems, software sometimes does not behave as expected. This may be due to a number of factors, for example, interactions with other cores, software, peripherals, real-time events, poor implementations or some combination of all of the above.
It is not always possible to use a debugger to observe behavior of a running system as this is intrusive. Providing visibility of program execution is important. One method of achieving this is via a processor trace. This can be used to work out where code has been, how long things took, to analyze task switches, interrupts, and to generate code coverage reports. If one thinks of traditional debugging as a series of snapshots, then trace- based debugging is a video with timestamps.
In contrast to the uniform RISC-V debug standard, there will be two RISC-V trace standards: The N-Trace standard and the E-Trace standard. The specifications necessary for either one of them are about to be ratified, and should be finalized in the second half of 2024. As with the debug standard, Lauterbach has made significant contributions to both trace standards within three RISC-V Processor Trace Task Groups. Currently, two proprietary trace solutions are widely used, the SiFive Nexus trace for RISC-V and the trace solution from Tessent Embedded Analytics.
When implementing the SiFive Nexus trace, both the cores and the trace IP must be from SiFive. An integration into Arm CoreSight is also possible. In this scenario cores and trace encoder must be from SiFive, the rest of trace IP can be from Arm.
In contrast the Tessent trace allows the implementation of RISC-V-cores from any vendor. Only the whole trace IP is from Tessent. When the chip implements additional Arm cores, an integration into Arm CoreSight is possible as well. In a joint RISC-V/Arm-core implementation with CoreSight, the RISC-V-core(s) can be from any vendor while the trace IP comes from Tessent and Arm repspec respectively for the Arm core(s).
As Figure 2 shows, there will probably be proprietary trace solutions from several IP manufacturers in the future that are derived from the respective trace standards. These are currently still being developed or planned.
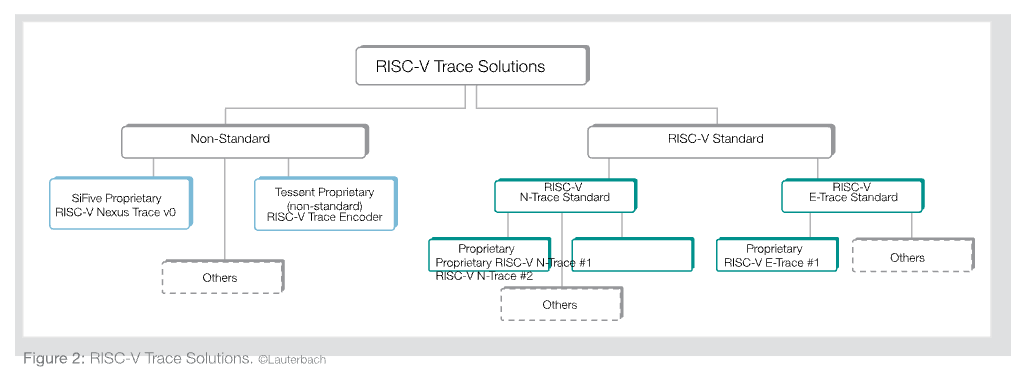
Figure 3 shows an overview of both RISC-V trace standards. The trace standards are split up into multiple documents. Some documents like the RISC-V Trace Control Interface Specification and the RISC-V Trace Connector Specification are shared among both standards (N-Trace / E-Trace), other documents are exclusive to one standard or the other.
Due to the architecture, it is even possible to mix N- and E-Trace encoders on one chip. With the N-Trace, the trace message format is based on the Nexus IEEE-ISTO 5001 standard. It’s called N-Trace instead of Nexus to make clear that there are differ- ences to the original Nexus. N-Trace is the successor of the proprietary SiFive Nexus Trace.
For E-Trace the trace message format is based on a new trace format developed by Tessent Embedded Analytics. It’s the successor of the proprietary Tessent trace.
It is not enough to just generate trace data, the data should also be made available to debuggers or other development tools. To make this possible, the RISC-V Trace Control Interface Specification defines several components like trace funnels or trace buffer memo- ries. The allowed inputs for the standard RISC-V trace funnel (RVFUNNEL) are the RISC-V trace encoders (N-Trace or E-Trace) or other RISC-V trace funnels. The allowed funnel outputs are a RISC-V trace sink or other RISC-V trace funnels. RVFUNNEL is not allowed to connect to any 3rd party trace IP (3rd party trace sources, funnels or trace sinks). Trace sinks are defined for off-chip trace (Pin Interface Block PIB, a parallel off-chip trace port similar to Arm’s TPIU) and on-chip trace providing three alternatives.
An SRAM on-chip trace sink is a circular-buffer on-chip trace RAM similar to Arm’s Embedded Trace Buffer (ETB); an SMEM on-chip trace sink is a memory range in system memory reserved for trace similar to Arm’s Embedded Trace Router (ETR); finally, an ATB Bridge allows for feeding the RISC-V trace stream into an Arm CoreSight trace infrastructure with ATB bus.
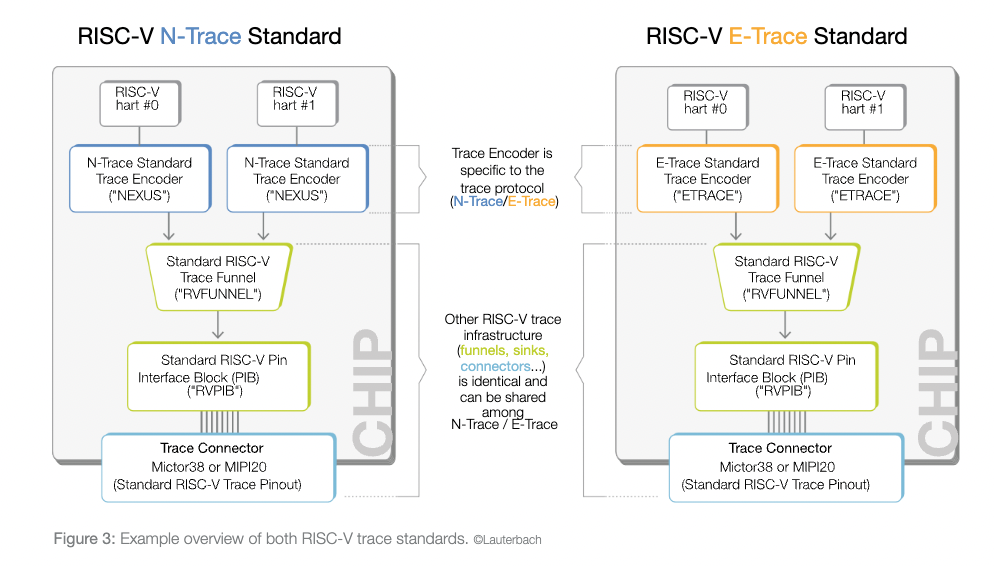
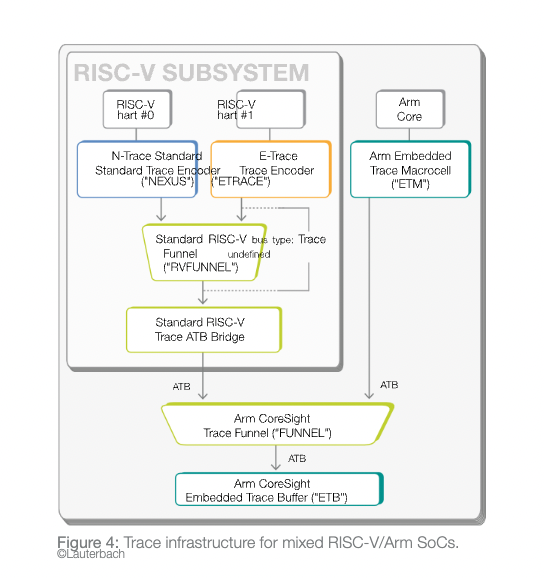
Figure 4 shows the integration in a chip with RISC-V and Arm cores using the Arm CoreSight infra-struc- ture. This uses the Advanced Trace Bus (ATB) as the main transport bus. Multiple trace sources that are transmitting to one ATB can be distinguished via the ATB-ID (ATID). A RISC-V Trace Encoder or RISC-V Trace Funnel cannot have a direct ATB output, as they do not have the possibility to add an ATB-ID (ATID). To connect a RISC-V trace system with an Arm CoreSight trace infrastructure (which uses ATB), a RISC-V ATB Bridge is therefore necessary.
As Figure 4 shows, there can be multiple trace funnel types in one system, each with its own component type. The RISC-V Trace Funnel (RVFUNNEL) works with an unspecified input and output bus type (not ATB due to missing ATID), while the Arm CoreSight Trace Funnel (FUNNEL) works with an ATB input and output bus type.
RISC-V N-Trace vs E-Trace
Comparing the two “competing” RISC-V trace standards, N-Trace and E-Trace, one cannot say that one or another is better. Regarding the features, there is no big difference. Most trace encoder features are available for both: instruction trace, filters, timestamps and others.
Data trace is supported in E-Trace v2.0. The N-Trace working group is planning that a future N-Trace v2.0 standard will support data trace as well.
The trace infrastructure (funnels, sinks, etc) is identical. Regarding compression and reliability, we cannot give any statements at this point, because the standards are too new to publish reliable empirical values.
Lauterbach TRACE32® trace tools support all the before mentioned proprietary and future RISC-V trace standards. They support real-time on- and off-chip tracing for all major RISC-V trace infrastructures.
One Solution for All Different RISC-V Chips
Lauterbach’s modular TRACE32® system is designed to grow and adapt as needed – from virtual targets and simulators to real silicon. All modules are driven by the same intuitive user interface to maximize the return on investment. Developers can easily switch from one RISC-V-based SoC to another RISC-V- based SoC while keeping the same debug and trace module and user interface. All Lauterbach debug and trace solutions for RISC-V are summarized at Lauterbach’s RISC-V website [6]. Thanks to the long- standing close partnership with RISC-V processor designers and semiconductor manufacturers, future chip developments are also accompanied by proven Lauterbach tools from the very beginning – ensuring a futureproof investment.
References