
By: Frank Riemenschneider, Senior Marketing Engineer at Lauterbach GmbH
Microchip’s PolarFire® System-on-Chip Field-Programmable Gate Array (SoC FPGA) family implements a total of five SiFive U54 and SiFive E51 64-bit RISC-V CPUs. With the right debug tools, mastering RISC-V multicore debugging of the entire software stack, including operating systems, applications, and additional softcores in the FPGA logic, is not rocket science.
Save time and effort when debugging PolarFire® SoC FPGAs
The PolarFire® SoC FPGA family delivers a combination of low power, thermal efficiency and security for smart, connected systems. It implements a deterministic, coherent RISC-V CPU cluster and a deterministic L2 memory subsystem for building Linux® and real-time applications using an real-time operating system (RTOS) such as the Zephyr™ OS. To debug such a complex multicore system, including operating systems, in a time and cost-efficient manner, you need the right procedures and tools. We have written this blog post to assist embedded developers in this process.
Background
Microchip’s PolarFire system-on-chip field-programmable gate array (SoC FPGA) family makes it faster and easier to complete highly integrated designs with up to 50% lower power consumption than alternative FPGAs. In addition to the FPGA logic, it implements a hardened microprocessor subsystem consisting of a SiFive E51 RISC-V RV64IMAC monitor core and four SiFive U54 RISC-V RV64GC application cores. The U54 includes multi-core support complemented by a memory management unit (MMU) and cache coherency. The 64-bit E51 CPU serves as the management core and is fully coherent with the main U54 cores.
The U54-MC RISC-V core is ideal for applications that require full operating system support, such as AI, machine learning, networking, gateways, and smart IoT devices. It’s fair to say that the RV64GC ISA has become the standard for Linux-based RISC-V devices.
However, if there are hard real-time requirements, it’s also possible to configure an Asymmetric Multiprocessing (AMP) setup on PolarFire® SoC FPGAs bare-metal or with an RTOS (Figure 1).
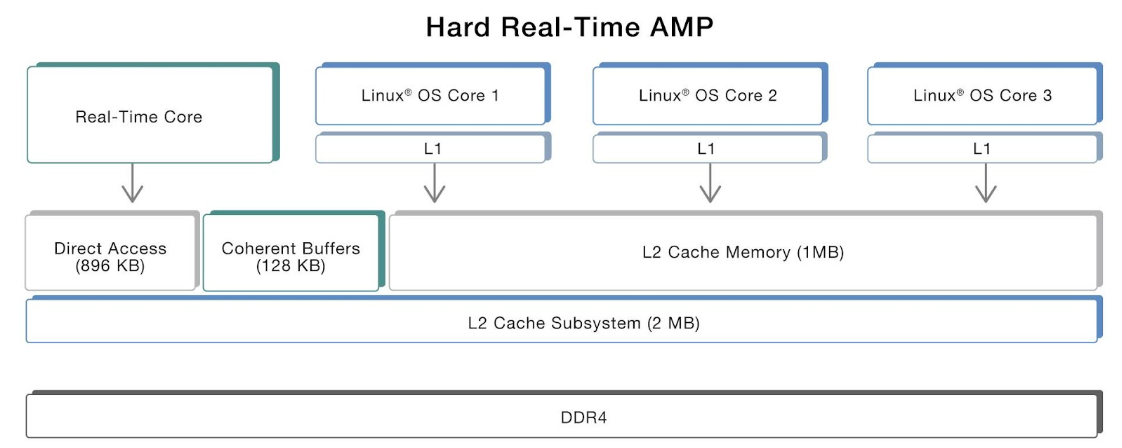
Figure 1: Real Time Configuration in PolarFire SoC FPGA. Source: Lauterbach.
Finally, developers can implement additional CPUs as a soft core in the FPGA logic, e.g. the MiV_RV32 soft CPU IP, which can be used as a basis for third-party operating systems such as SAFERTOS® from WITTENSTEIN.
In summary, a suitable debug and trace environment for PolarFire SoC FPGAs must be able to cover all these scenarios. As the market-leading debug and trace tool suite, TRACE32® from Lauterbach offers everything you need to meet all these requirements and to debug complex systems in a time- and cost-efficient manner. Let’s see how it works.
Debug PolarFire SoC FPGAs quick and easy
RISC-V’s open-source nature and diverse ecosystem present unique challenges for debugging applications. To avoid a proliferation of proprietary debug interfaces, a working group within the RISC-V Foundation has defined a debug standard that has been adopted by Microchip for the PolarFire family. Lauterbach, the world leader in debug and trace tools, has been a strategic member of the RISC-V Foundation since its inception and has made significant contributions to the debug standard within the working group.
The most important debug feature for PolarFire SoC FPGAs is of course the almost unlimited multicore support (Figure 2). With Lauterbach’s TRACE32® tools, developers can debug and control RISC-V cores in almost any combination, even with other CPU architectures, via the single JTAG debug interface. No matter what type of multicore system is used, TRACE32® supports them all. TRACE32® supports full on-chip breakpoint support, run-time memory access, flash programming, and benchmark counters. Everything is scriptable, making it easy for developers to automate tests.
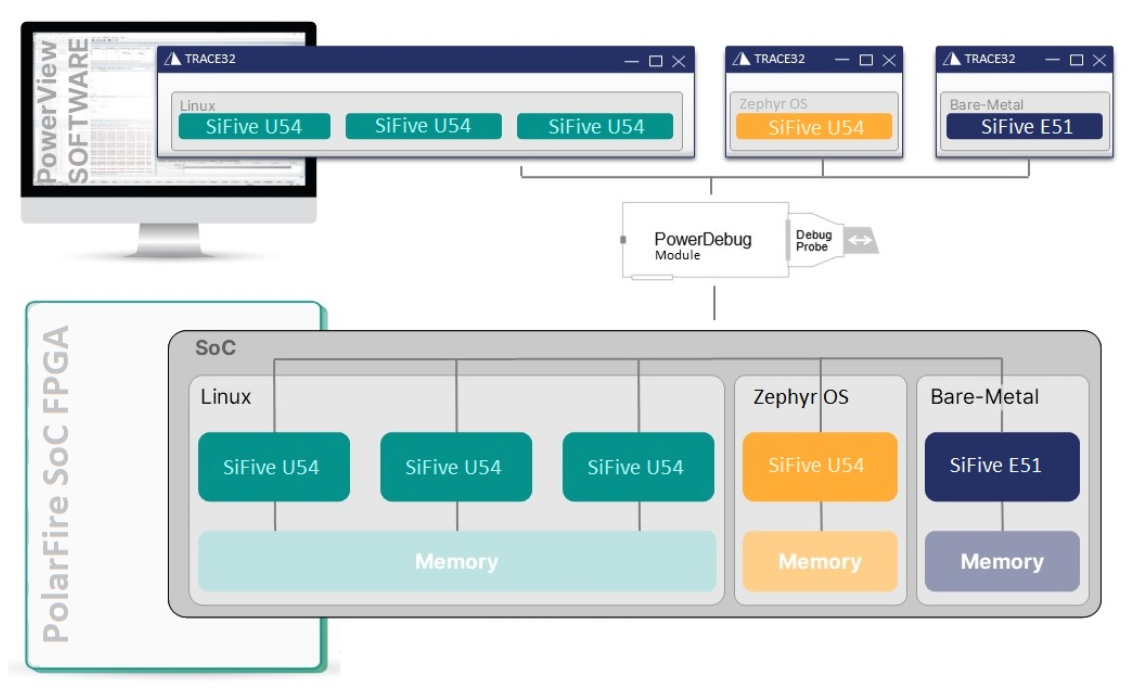
Figure 2: Multicore Debugging of all five RISC-V CPUs in PolarFire SoC FPGA. Source: Lauterbach GmbH.
Second, it is important to be able to debug the entire software stack. If you are running different operating systems (e.g. RTOS + Linux) and multiple applications, it can be difficult to find bugs. Lauterbach’s TRACE32® OS-aware debugging provides critical insight into applications and the operating systems they run on, whether they are rich operating systems such as Linux, real-time operating systems such as Zephyr OS, or a mixture of the two. TRACE32® OS-aware debugging can query and display all OS objects such as threads, message queues, and more. This enables engineers to better understand how they behave and how they use chip resources.
Finally, evaluating the right debug tool should not be a challenge. Lauterbach’s unique and sophisticated chip finder at https://www.lauterbach.com/supported-platforms/chips allows you to find all suitable products in just a few seconds (Figure 3).
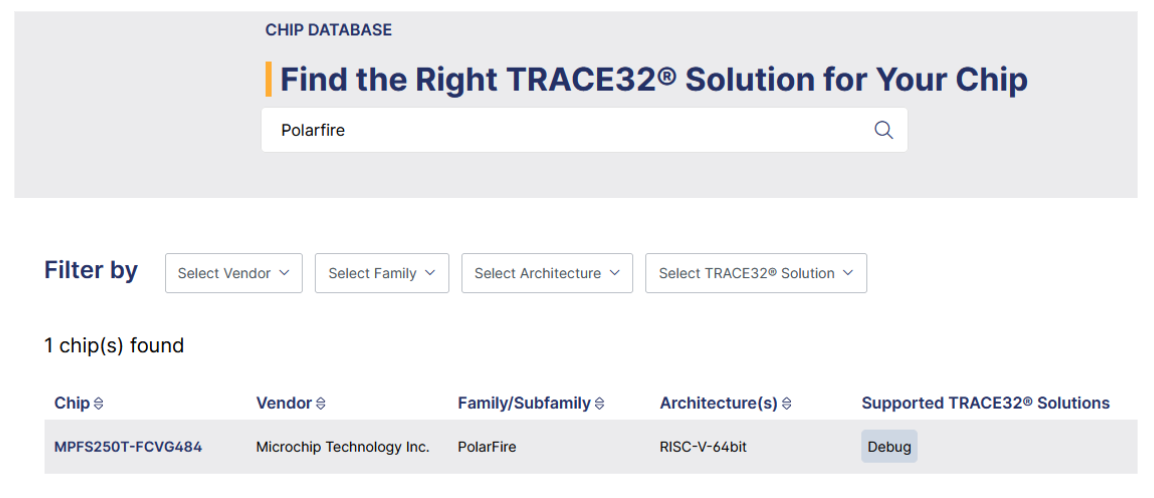
Figure 3: Chip Search on https://www.lauterbach.com/supported-platforms/chips. Source: Lauterbach GmbH.
Trace PolarFire SoC FPGAs and see your code in action
In complex systems, understanding program behavior is not easy. Not surprisingly, software in such systems sometimes does not behave as expected. This can be due to a number of factors, including interactions with other cores, software, peripherals, real-time events, poor implementations, or a combination of all of the above.
It is not always possible to use a debugger to observe the behavior of a running system because it is intrusive. It is important to provide visibility into program execution. One way to do this is with a processor trace. This can be used to find out where code has been, find out how long things took, analyze task switches and interrupts, and generate code coverage reports. If you think of traditional debugging as a series of snapshots, then trace-based debugging is a timestamped video.
To enable real-time tracing, the PolarFire SoC FPGAs implement the Tessent Embedded Analytics (formerly UltraSoC) RISC-V trace encoder, which has been supported by Lauterbach from the very beginning. Using the TRACE32® CombiProbe, it’s even possible to trace the Hard-IP SiFive CPU cores and simultaneously debug a softcore in the FPGA logic (see Figure 4). An average streaming speed of 140 MB/s ensures reliable transfers with no data loss. When using Lauterbach’s chip search function, the CombiProbe is also displayed within a few seconds.
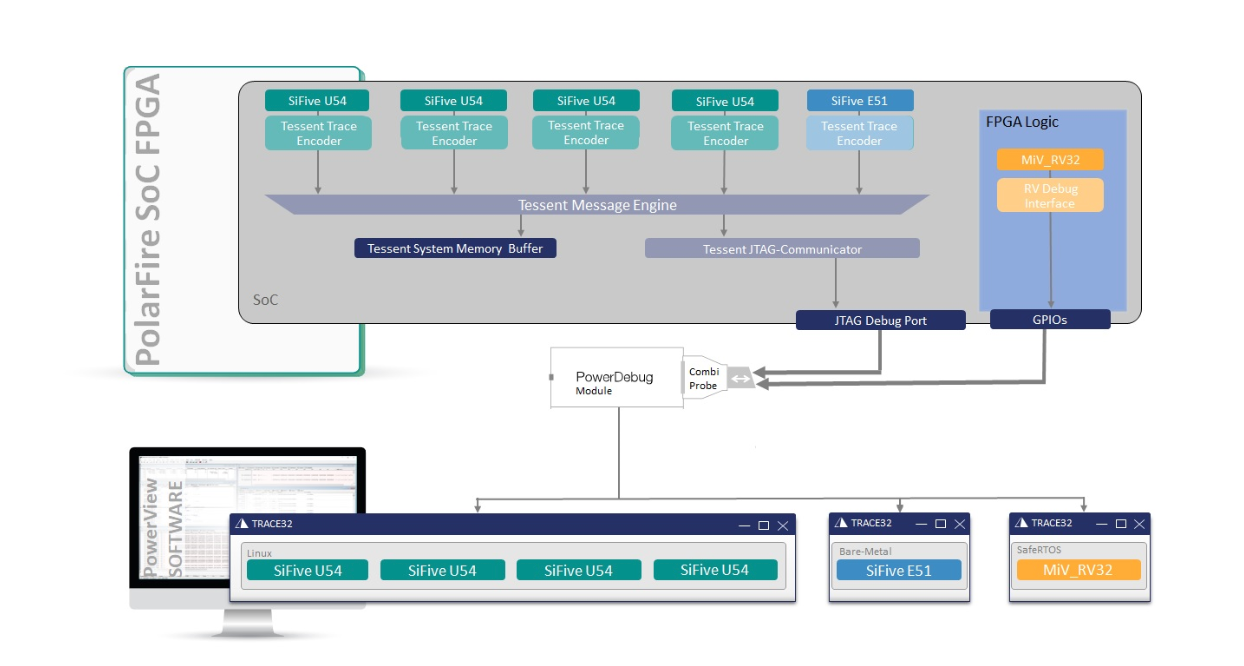
Figure 4: Multicore Trace PolarFire SoC FPGA with five Hard-CPUs and one Softcore. Source: Lauterbach GmbH.
Take Action
For more information please contact Lauterbach at Sales@Lauterbach.com or visit www.Lauterbach.com.