
Authors: Robert Chyla and Thomas Andersson, IAR Systems In embedded software development, utilizing full application trace gives developers endless possibilities to analyze their product’s behavior. With complete insight into the application, they can track every single instruction and see if their application is running as intended, or if errors or vulnerabilities occur. So, how can you best utilize trace which is now available for RISC-V?
What is Trace?
In contrast to traditional debugging by setting breakpoints, printf, etc., trace is more like observing your application without intruding. Basically, developers can watch the full application at work without disturbing it. Trace can include a full PC flow (no need for printf nor UART) and once trace data has been captured, you can go back to quickly isolate exceptions and hard faults. This makes finding bugs that are rare and dependent on order-of-execution much easier since this provides a trail of what the program has executed but also in what order. This allows the developer to understand exactly how and why they ended up at a particular line of code. You can quickly find exceptions and hard faults, and therefore find bugs which are rare and dependent on the order of execution. Without trace, if you experience a crash of your program it is hard to recreate what actually happened. However, trace is not only about finding bugs. Trace allows for profiling, code coverage, etc., and you can live-stream the behavior of your device. Performance and coverage monitoring are powerful features that are made possible when you have trace available. If you have a broad bandwidth, even live trace streams can be integrated in your debugger.Trace for RISC-V
One of the major focus points of the RISC-V organization is working towards a standardized specification for RISC-V. Working groups, which are open to all RISC_V members, are currently focusing on developing these specifications. One example is the Processor Trace working group, which ratified the processor trace specification this past February. Another example is the Nexus Trace group that is working on recommendations of how to use trace as defined by the Nexus IEEE-ISTO 5001™ standard for RISC-V cores. This work will continue, as all aspects of trace standard have to be considered. Among other things, this includes the trace control export formats. The minimum goal is to get on par with what already exists for more mature architectures. If the RISC-V trace specification is done right, it will enable easy adoption of existing trace viewers, hardware trace probes and trace analysis tools. A few implementations are already available, but the RISC-V architecture should have trace in every device from IoT to servers. Even simple, standard trace is better than no trace.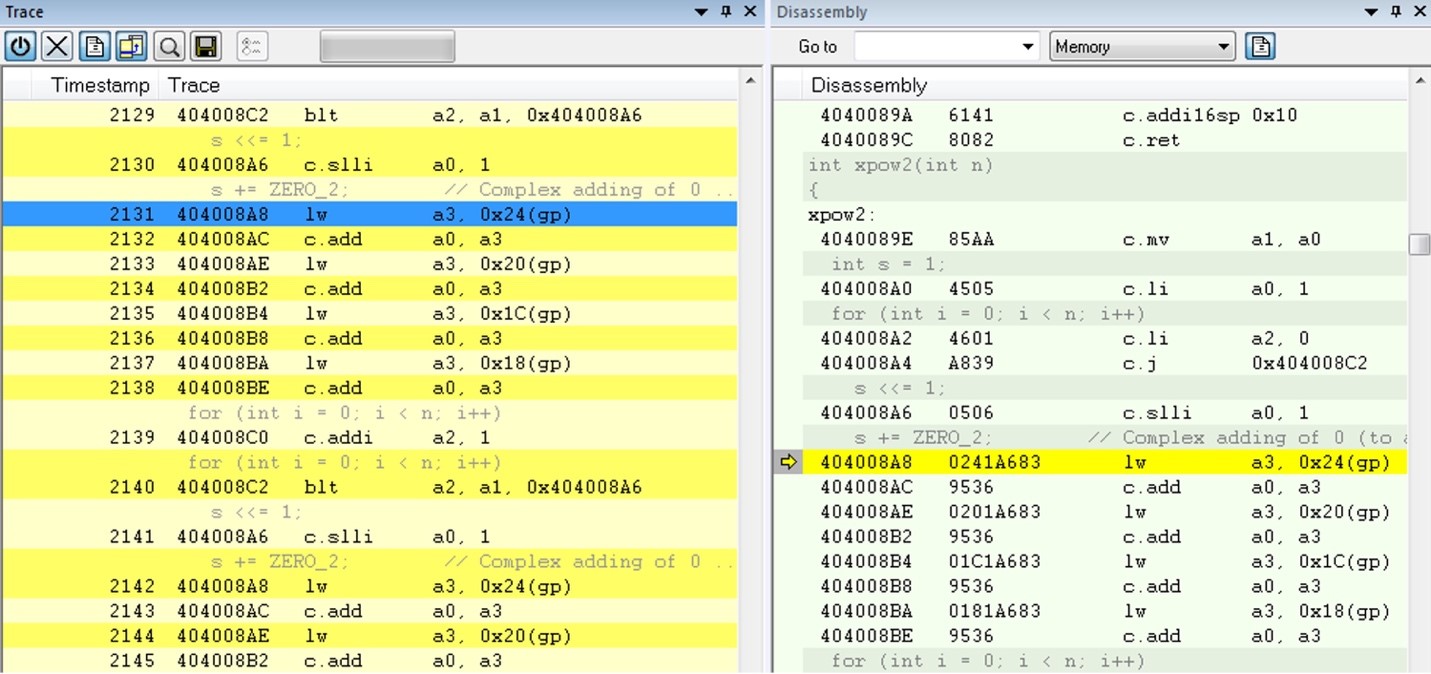 Figure 1. Trace from a RISC-V device
Seeing Every Instruction
The integrated support for trace in software development tools enhances everyday code development/debugging. Trace should be an inherent part of the designer’s everyday environment and should not be something you analyze afterwards. So you can write your code, make it run and see how you have arrived at your current execution point. You can iterate and get good code quality directly, as you can go back and quickly isolate exceptions and hard faults. You can also find bugs that are dependent on order-of-execution and find power measurements which can be correlated with your program flow. All these analyses can also be done in a multicore environment with its challenging and complex dependencies. Going through a captured trace can be like finding a needle in a haystack when looking for a bug. In just a few seconds of execution time, hundreds of millions of instructions can be produced. Therefore, it is extremely important that the specification will provide enough triggers to be able to limit the capture only to specific areas. Advanced navigation and search capabilities are essential and if your compiler/debugger tools offer that feature, use trace triggers to constrain trace data to only what you need.Why Do I Want Trace?
Implementing trace IP into your device gives you the possibility to non-intrusively track your product as it is running. Even adding low level debug printouts will change the timing of your application and obscure its true behavior. There are many ways to capture and get trace data exported out from a device:- Serial
- Enough for PC sampled trace (good for statistical code profiling)
- Light instrumentation, real-time operating system (RTOS) monitoring, variable tracing etc.
- With a good probe it is still possible to reach speeds up to several megabytes/s
- High speed parallel interfaces (4 to 16-bit dual-edge)
- Capture everything (clock speed can be very high)
- Traces via “breadcrumbs” left when control flow diversion occurs
- Guarantees you every single instruction executed
- Trace breadcrumbs are stored on debugger probe
- RAM Buffer
- Either small dedicated RAM or shared with system memory
- Even 4KB of trace RAM can provide enough to be really useful
- High speed serial
- Speeds of 10 Gbits/s or higher
- Mainly suitable for bigger, complex systems
- Trace over functional interfaces (USB3.0 provides a lot of bandwidth!)
- Use cases are limited – not an option for small IoT devices
Debugging Exceptions
By using trace in your daily routine, you can really see how your application runs. You can inspect the program flow up to a specific state, such as an application crash, and use the trace data to locate the origin of the problem. Exceptions or unhandled faults can be caused by pointer problems, illegal instructions or data aborts. Typically, your stack (and call-frame information) is trashed when this happens, but with trace you have the full application history. Trace data can also be useful for locating programming errors that have irregular symptoms and occur sporadically. This could help find “million-dollar” bugs.Hardware and Software Tools Integration
The best approach to get as high quality code as possible is to integrate trace analysis capacity in your everyday development environment. If you can verify timing and correctness every time you deploy a change, the risk of pushing complex bugs to late system verifications or even to customers are greatly reduced. The best solution is to have hardware tools like a trace debug probe which seamlessly works with software tools in your integrated development environment. IAR Systems for example offers the trace probe I-jet Trace which is fully integrated with the complete C/C++ compiler and debugger toolchain IAR Embedded Workbench. I-jet Trace unlocks several advanced capabilities in the IAR Embedded Workbench IDE. In Figure 2, you can see an example of a few advanced view capabilities, with a timeline at the top and a code stack on the bottom. This is showing the program running where one call is calling another and you can see interrupts. The blue part shows data tracing, so you can have instrumentation, and see the RTOS switching, etc. The detailed graph below shows the startup code running – with complex calls, and some longer and shorter functions and even a tool tip to optimize the code for one of the calls.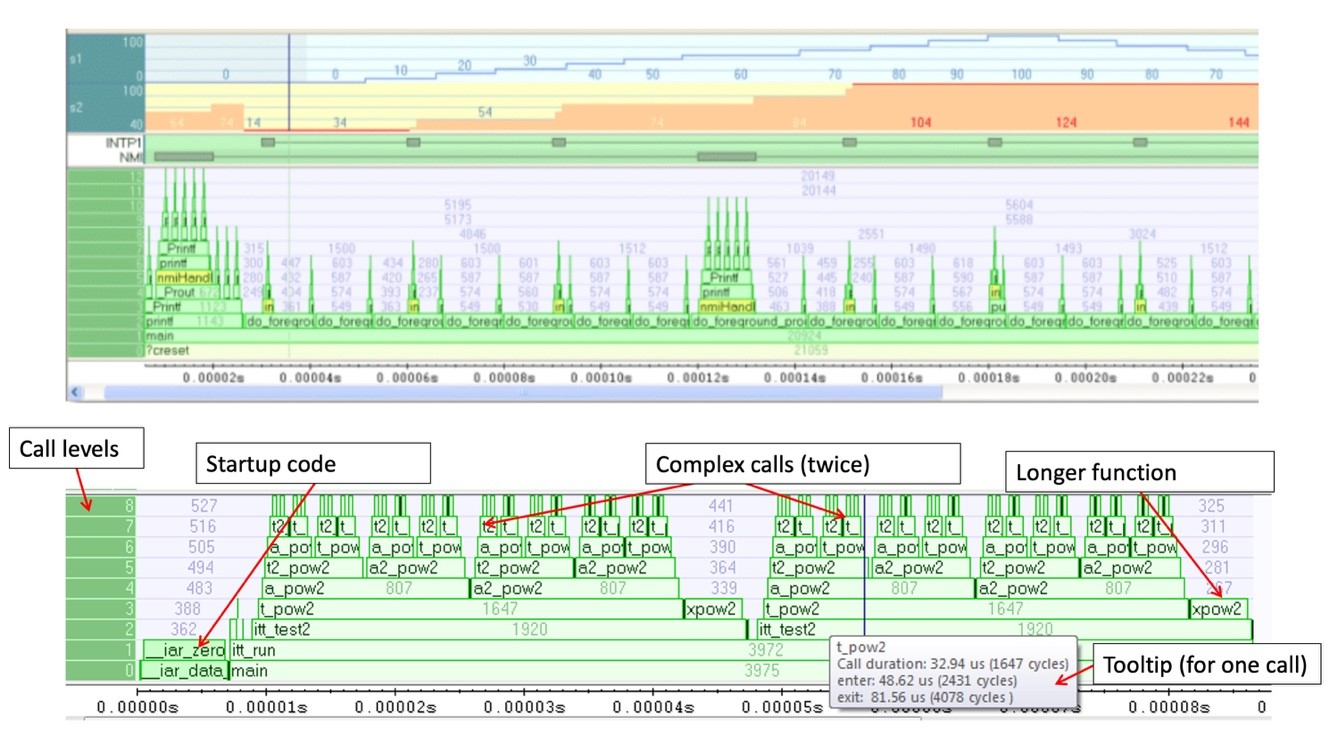 Figure 2. Example of a Timeline combining the call stack and interrupts and variable logs
Code Quality
But trace is not only about finding bugs. It also helps you to monitor your application – does it run as intended? Integrating performance monitoring is one of the major benefits of using trace as it helps you understand where your application is spending its execution time, if it is suffering from interrupt storms, if it sometimes does not respond fast enough, etc. Code coverage is also a feature that can be implemented using trace (figure 3 demonstrates how it looks in IAR Embedded Workbench). This can be used to prove code has been exercised at least once, isolate dead code, show test deficiencies and more. Functional safety certifications strongly recommend code coverage as a mean to increase quality. A good complement to a trace profiler are static code analysis tools. This ensures code compliance with industry-specific standards and best programming practices. In addition to coverage, the tool can collect how many times each individual instruction was run. For example, some block of instructions was executed 4 times, and some 12 times. Obviously not-covered code was executed 0 times.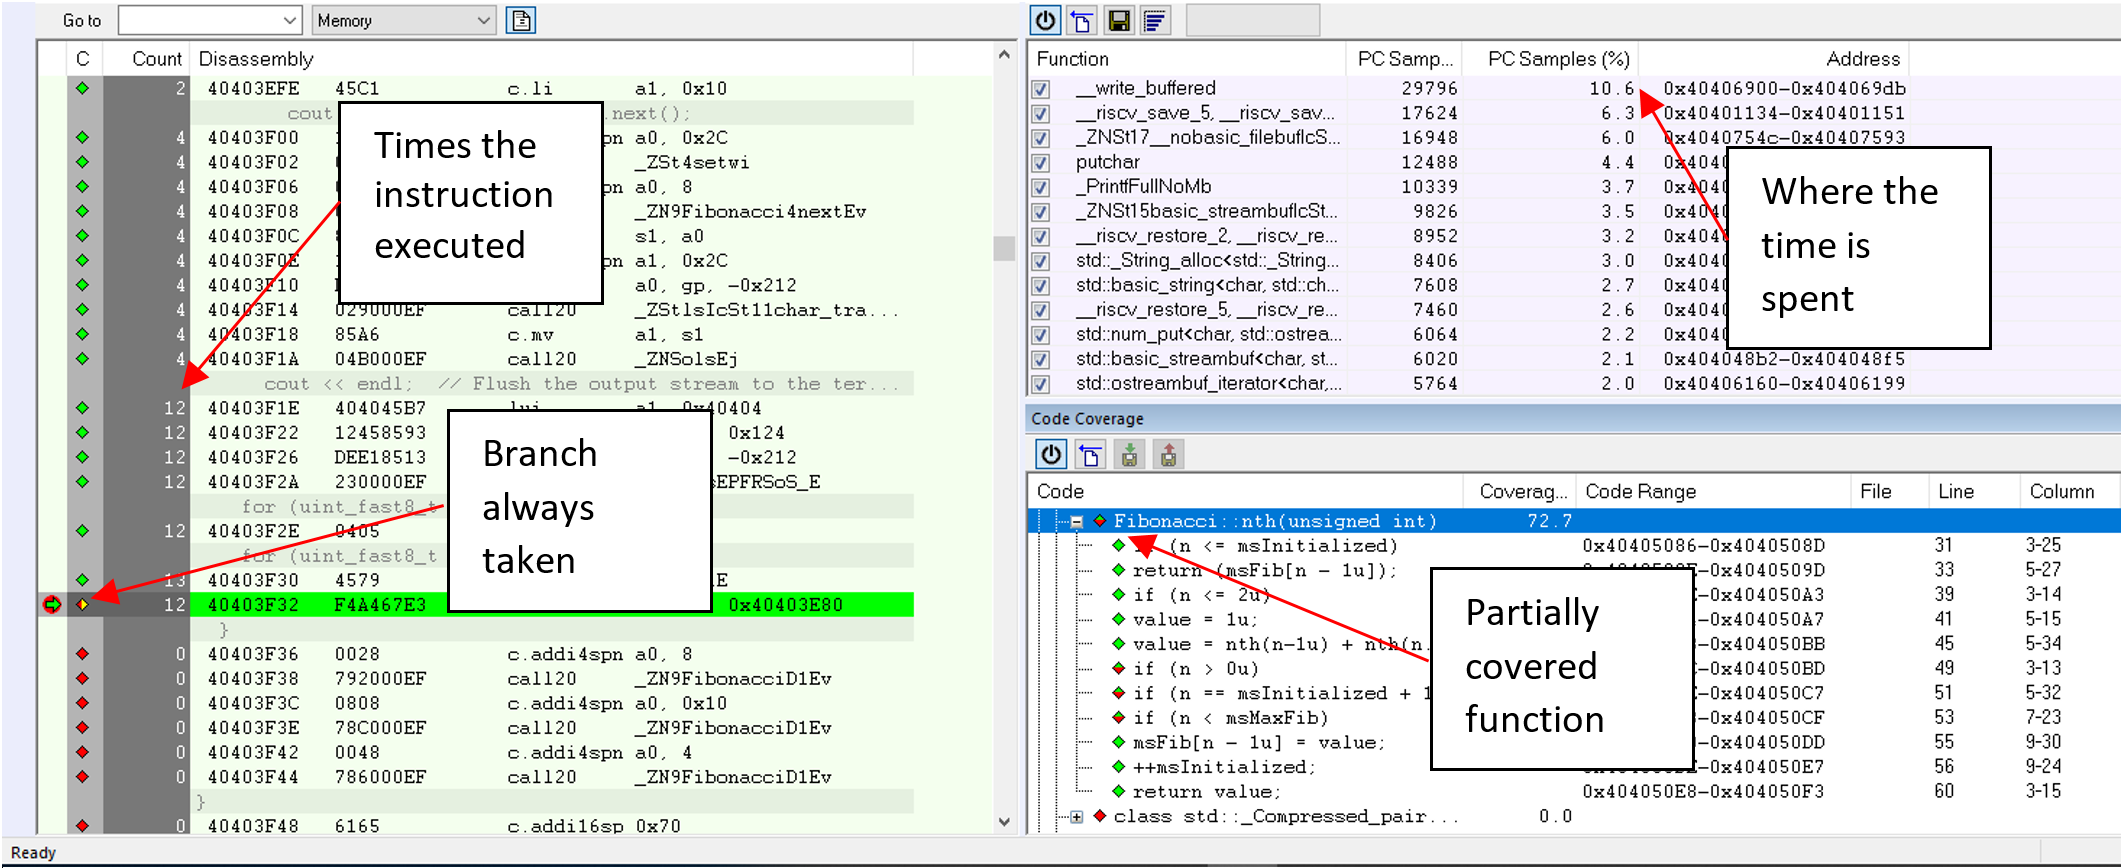 Figure 3. Trace can also review code coverage
Conclusion
Trace provides a variety of beneficial data sources, such as collecting data or assisting developers in filtering the information into actual knowledge and insights. Visualizing and analyzing with different trace viewers creates a true description of how a product runs and its dynamic behavior that provides the necessary information for developers to track down complex bugs that are often hard, or even impossible to catch by other means. By incorporating trace in their daily development routine developers can accelerate the software development process and increase software quality.About the Authors:
Thomas Andersson, Product Manager, IAR Systems With substantial background in advanced system design and product management for several Swedish flagship companies, Thomas joined IAR Systems as a Product Manager in 2017. In his current role as a Product Manager for IAR Embedded Workbench for RISC-V as well as IAR Systems’ debug and trace solutions, Thomas is driving the development and design of several of the company’s current focus products. Thomas holds a Master of Science in Engineering Physics from Uppsala University. Previously to joining IAR Systems, he has held positions in product management and system design for radio and cellular systems at Ericsson and ST-Ericsson, as well as doing hardware design for high frequency radar systems with SAAB Avitronics.
Robert Chyla, Lead Emulation Architect, IAR Systems
With substantial background in advanced system design and product management for several Swedish flagship companies, Thomas joined IAR Systems as a Product Manager in 2017. In his current role as a Product Manager for IAR Embedded Workbench for RISC-V as well as IAR Systems’ debug and trace solutions, Thomas is driving the development and design of several of the company’s current focus products. Thomas holds a Master of Science in Engineering Physics from Uppsala University. Previously to joining IAR Systems, he has held positions in product management and system design for radio and cellular systems at Ericsson and ST-Ericsson, as well as doing hardware design for high frequency radar systems with SAAB Avitronics.
Robert Chyla, Lead Emulation Architect, IAR Systems
 With extensive experience from trace technology including advanced multi-core systems, Robert Chyla joined IAR Systems in 2011 when the company acquired his previous employer Signum Systems. For more than 20 years, Robert has been focusing on high-end JTAG and trace emulation and debug tools. As a Lead Emulation Architect at IAR Systems, Robert is responsible for the software architecture and software/hardware interface of the company’s debugging and trace tools. Before joining Signum and IAR Systems, Robert worked as an assistant professor and engaged into high-end 3D graphics rendering software development with the Japanese company Integra. Robert holds a Master of Science in Computer Science from Wroclaw Technical University in Poland.
]]>
With extensive experience from trace technology including advanced multi-core systems, Robert Chyla joined IAR Systems in 2011 when the company acquired his previous employer Signum Systems. For more than 20 years, Robert has been focusing on high-end JTAG and trace emulation and debug tools. As a Lead Emulation Architect at IAR Systems, Robert is responsible for the software architecture and software/hardware interface of the company’s debugging and trace tools. Before joining Signum and IAR Systems, Robert worked as an assistant professor and engaged into high-end 3D graphics rendering software development with the Japanese company Integra. Robert holds a Master of Science in Computer Science from Wroclaw Technical University in Poland.
]]>